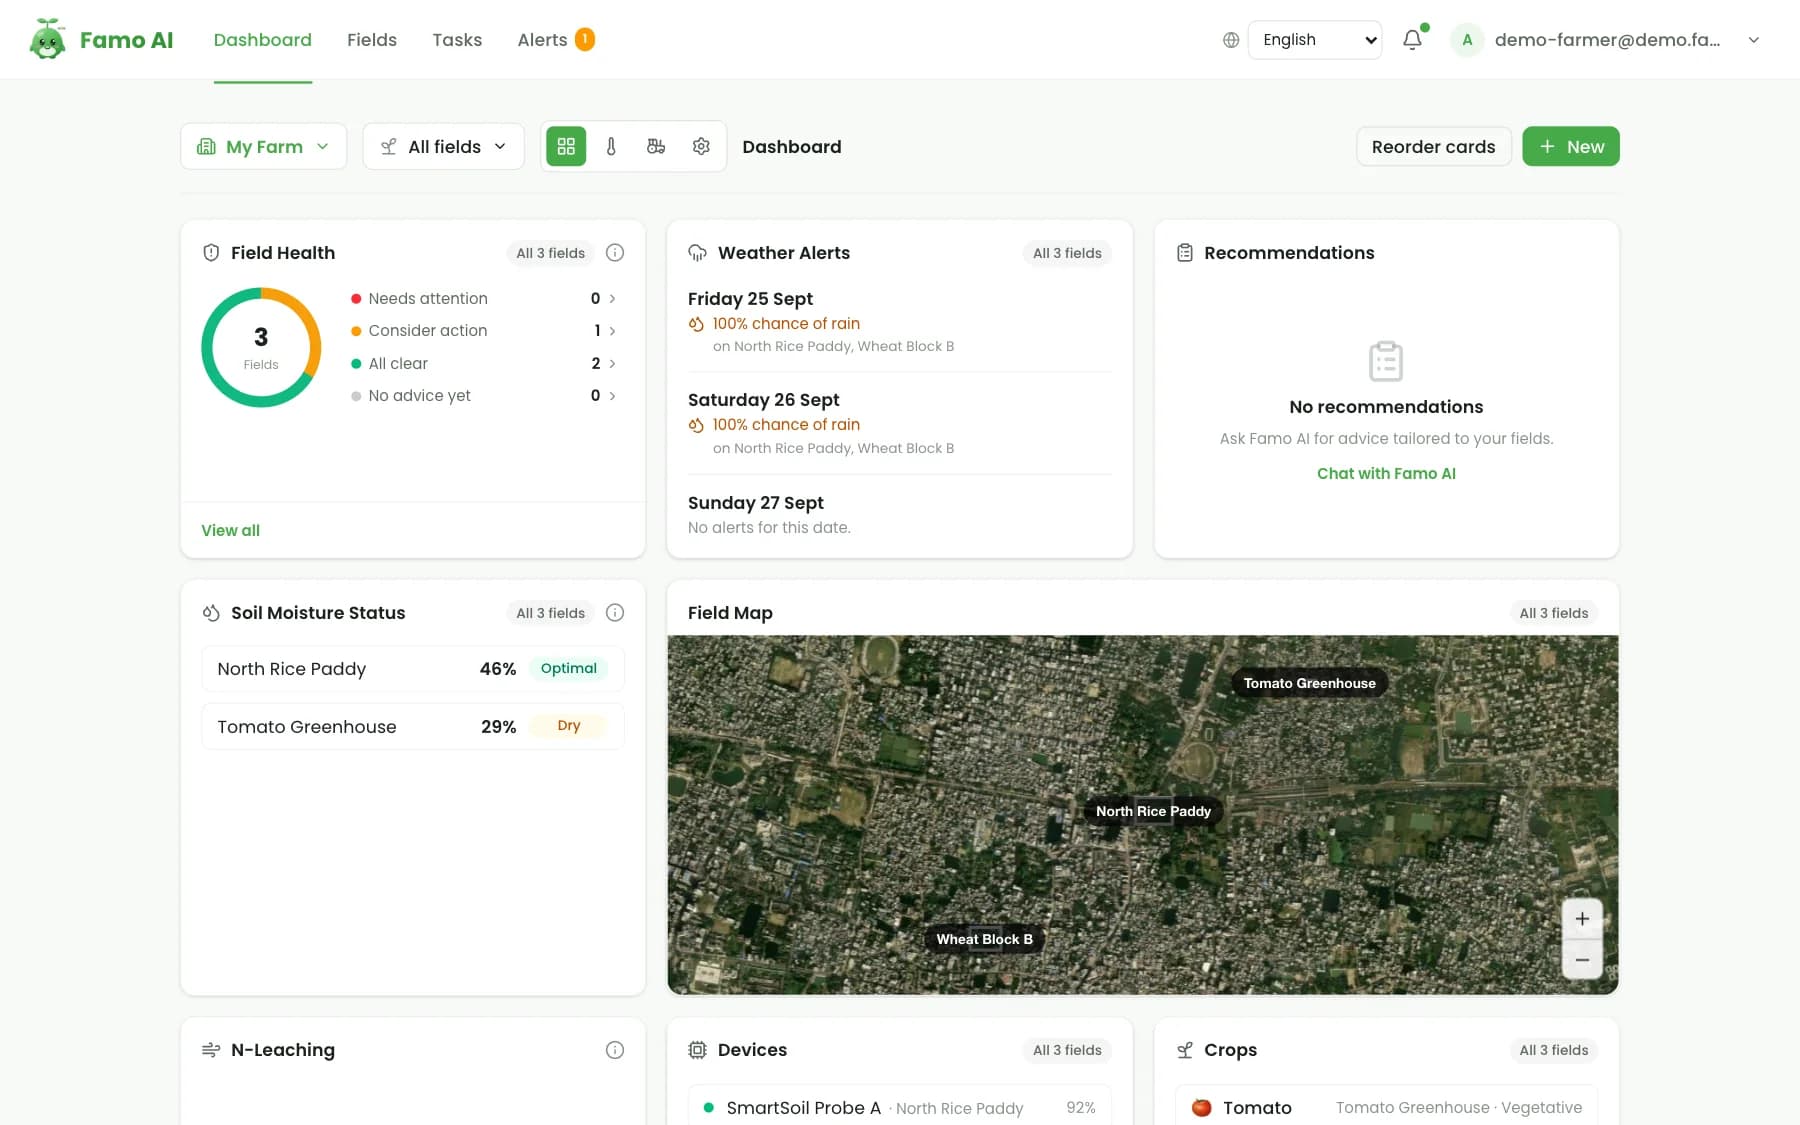
Walking every corner of every field, every week, is impossible on most farms. Satellites can do it for you. The European Space Agency's Sentinel satellites image almost every farm on Earth every few days, and the data is free. The challenge is turning those images into decisions. That is what Famo AI does.
How a satellite sees a crop
Healthy green leaves absorb red light for photosynthesis and strongly reflect near-infrared light. Stressed, thin or dying vegetation reflects less near-infrared. By comparing reflected light in different bands, we can calculate vegetation indices — single numbers that describe the crop at every point in a field.
The indices that matter most
| Index | What it shows | Most useful for |
|---|---|---|
| NDVI — Normalised Difference Vegetation Index | Overall green vigour and canopy density, from about 0 (bare soil) to close to 1 (dense healthy crop) | Spotting weak areas, tracking growth over the season |
| NDRE — Normalised Difference Red Edge | Chlorophyll in the canopy; stays sensitive in dense, mature crops where NDVI saturates | Nitrogen status in mid and late season |
| NDWI — Normalised Difference Water Index | Water content in leaves | Water stress and irrigation planning |
| SAVI — Soil-Adjusted Vegetation Index | Vigour with the effect of bare soil reduced | Young crops and sparse canopies |
Famo calculates more than 30 indices from Sentinel-2 optical imagery and also uses Sentinel-1 radar, which sees through clouds — essential in monsoon and rainy seasons when optical images are often blocked.
What Famo does with the images
A raw NDVI map is a colourful picture. Famo turns it into a field report:
- A health score for the field and how it has changed since the last scene.
- Stress zones — the parts of the field that are below the rest, outlined on the map with their area in hectares.
- A history of every scene, so you can see whether a problem is new, spreading or recovering.
- Zone breakdown — how much of the field is healthy, needs watching or is stressed.
Then Famo puts the report in context with the crop stage, the latest soil readings and the weather, and turns it into action: scout this corner, check nitrogen here, irrigate that block.
Getting started: draw your field
Satellite monitoring starts as soon as a field has a boundary. In the Famo app or dashboard, tap points around the edge of the field on the map (at least three) to draw its polygon — or import a GeoJSON boundary for larger farms. Imagery usually appears within one or two days.
What satellites can and cannot do
Satellites are powerful, but they work best alongside other information:
- Resolution. Sentinel-2 pixels are 10 metres across. That is fine for fields of a fraction of a hectare and up, but cannot show individual plants. For plant-level detail, drones fly in where the satellite sees a problem — part of Famo Open Field.
- Cause. An index shows that a crop is stressed, not why. Is it water, nitrogen, disease or pests? Famo answers that by combining the image with soil readings, weather and a crop-health scan on the ground.
- Clouds. Optical images are lost under cloud; radar fills part of the gap.
Why it matters for smallholders
Satellite crop monitoring used to be a tool for large estates with GIS specialists. Because the imagery is free and Famo does the analysis, a farmer with one hectare can see the same kind of information on a phone, in their own language — and organisations supporting thousands of smallholders can monitor every member's fields from the organisation dashboard.
See it on a real field
The live farmer demo includes satellite history for three sample fields — no sign-up needed. To monitor your own fields, download Famo AI and draw your first field.